Inspired by Zoho Analytics · Implemented by SavantX
From data to insights in minutes.
Agentic AI-powered self-service BI. We connect Zoho CRM, Books, Desk, and more into live dashboards — so leadership stops waiting on spreadsheet reports.
Official product: zoho.com/analytics
Official Zoho Development Partner
Setup · Customization · Automation · Support
500+
Data sources
50+
Visualizations
AI
Ask Zia insights
Overview
Why businesses choose Zoho Analytics
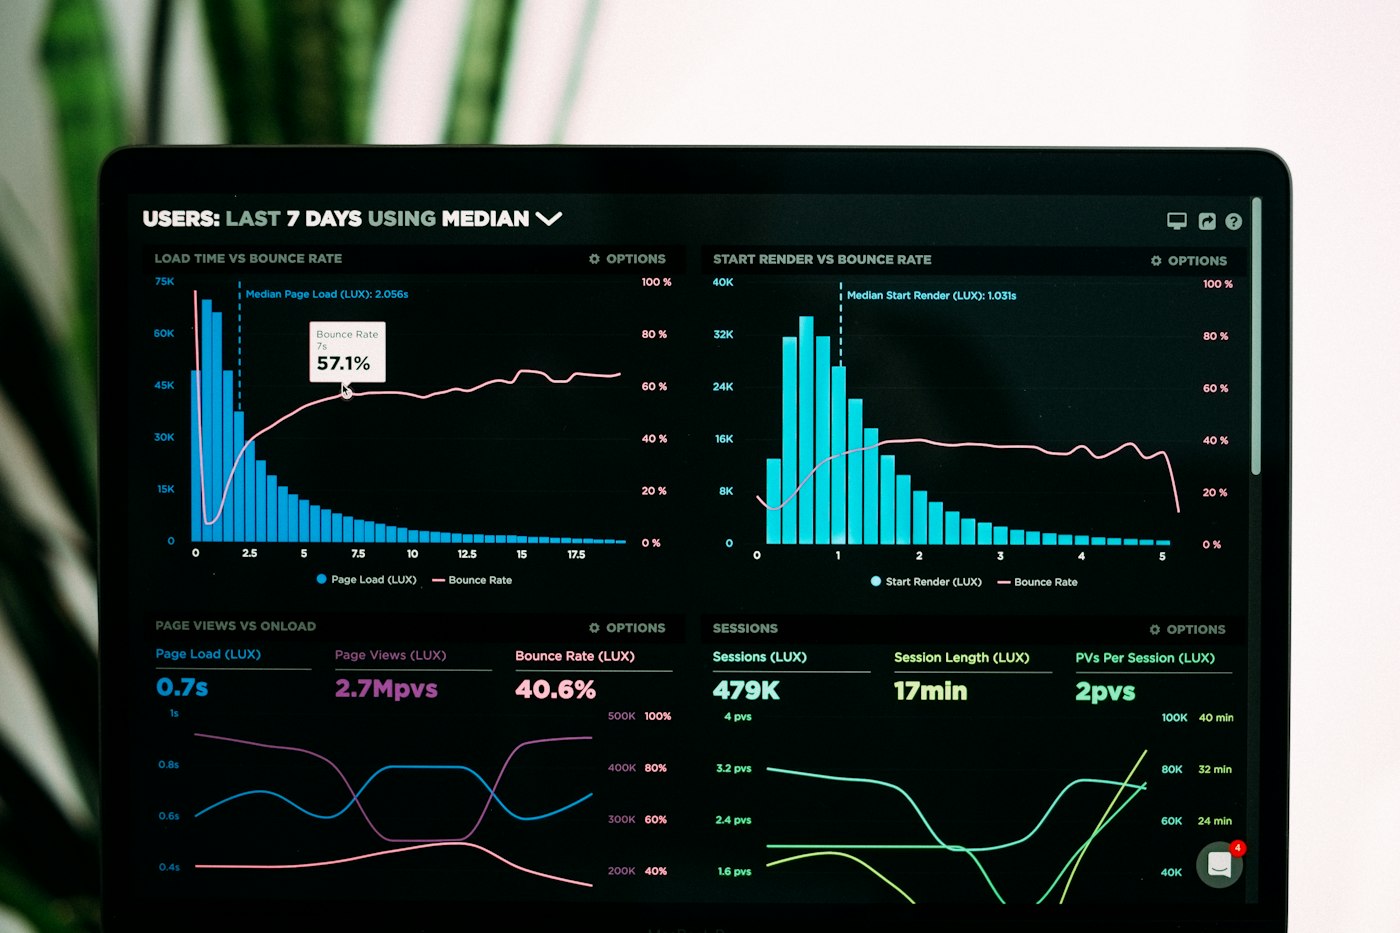
Zoho Analytics blends data from Zoho apps and outside sources into interactive reports. Cross-app dashboards can show pipeline, revenue, delivery, and support health together — the CEO view most teams never get.
Zoho Analytics is Zoho’s self-service business intelligence platform. It connects to Zoho CRM, Books, Projects, Desk, Inventory, and external sources so you can build live dashboards instead of exporting CSVs every Monday.
SavantX helps leadership teams define the KPIs that matter, then designs dashboards that answer those questions at a glance. We blend data across apps, apply the right formulas, and set sharing rules so each role sees the right slice of truth.
The result is faster weekly reviews, fewer “what’s the number?” debates, and a culture of decisions based on live data — not outdated spreadsheets.

Who Analytics is for
- Leadership teams drowning in manual reports
- Companies already on Zoho that lack a single source of truth
- Ops and finance leaders who need cross-department KPIs
- Growing businesses preparing for data-driven management
Common challenges
Problems Analytics solves
If these sound familiar, a properly implemented Zoho Analytics system can change how your team works.
Reports that take days to prepare
Analysts spend more time exporting and stitching data than interpreting it.
Conflicting numbers across teams
Sales, finance, and ops each have their own spreadsheet version of reality.
No cross-app visibility
Pipeline looks healthy in CRM while cash and delivery tell a different story.
Dashboards nobody trusts
Pretty charts with wrong joins or stale data destroy confidence in BI.
Business intelligence
What Analytics unlocks for your team
Core capabilities we configure, customize, and connect as part of a complete Zoho Analytics rollout — aligned with how Zoho presents the product.
Cross-App Dashboards
Combine CRM, Books, Projects, and Desk into one leadership view.
Visual Reports
Charts, pivots, KPI widgets, and geo maps that non-technical users can explore.
Data Blending
Join Zoho data with Excel, SQL, Google Sheets, and cloud sources.
AI-Assisted Insights
Ask questions in plain language and surface anomalies automatically.
Scheduled Delivery
Email or Slack reports on a cadence your team actually uses.
Row-Level Security
Managers see their slice; leadership sees the full picture.
Use cases
Built for real business scenarios
Founder / CEO Dashboards
Revenue, pipeline, cash, and delivery health in a single screen.
Sales Ops
Conversion funnels, win rates, and forecast accuracy by segment.
Operations
SLA, utilization, inventory turns, and project profitability.
Board & Investor Reporting
Clean, repeatable KPI packs without last-minute spreadsheet panic.
How Zoho Analytics connects in your Zoho stack
Like on Zoho's own product pages, Analytics is strongest when it shares data across the ecosystem — we wire those connections for you.
- Native connectors to Zoho CRM, Books, Desk, Projects, Inventory
- Google Sheets, Excel, and CSV imports
- SQL databases and cloud warehouses
- Scheduled email / Slack distribution
- Embedded dashboards in portals where needed
SavantX expertise
How we implement Zoho Analytics for you
We don't just turn the app on. We design it around your process, automate the busywork, train your team, and stay available when you need changes.
- KPI definition workshops with stakeholders
- Data connectors and blending setup
- Executive and team-level dashboard design
- Formula columns, query tables, and data prep
- Access control and sharing strategy
- Training so teams can self-serve insights
Our implementation process
A clear path from discovery to adoption — so Analytics becomes daily habit, not shelfware.
- 1
KPI Workshop
We define the questions leadership and teams need answered weekly.
- 2
Data Model
Connectors, joins, and metrics are designed for accuracy and reuse.
- 3
Dashboard Build
Executive and departmental dashboards are built and validated.
- 4
Enablement
Sharing rules, schedules, and training make analytics self-serve.
Results you can expect
- →Decisions based on live data
- →Less manual report building
- →Shared truth across departments
- →Faster weekly business reviews
No commitment · 30-minute Zoho system audit
FAQ
Frequently asked questions about Zoho Analytics
Straight answers about implementation, customization, and how SavantX helps.
Yes. Cross-app reporting is one of its strongest capabilities — for example pipeline from CRM with collections from Books on one dashboard.
Free Zoho strategy call
Ready to put Zoho Analytics to work the right way?
Tell us where you are today — new setup, messy configuration, or custom app needs — and we'll map the fastest path forward on a free 30-minute call.
Explore more Zoho apps
Each page is styled after that product's official Zoho experience.